
Media monitoring tools cost thousands of dollars a month. I built one from scratch — automated, free to run, and powered by NLP.
The Problem I Wanted to Solve
Keeping up with the news is easy. Making sense of it at scale is not.
Whether you’re a journalist, researcher, PR professional, or just someone who wants to understand what’s being talked about in the media, the challenge is the same: there’s too much content, published too fast, from too many sources.
Professional tools like Meltwater or Cision solve this problem, but their price tags put them out of reach for individuals and small teams.
So I built NewsLens.
So what Is NewsLens?

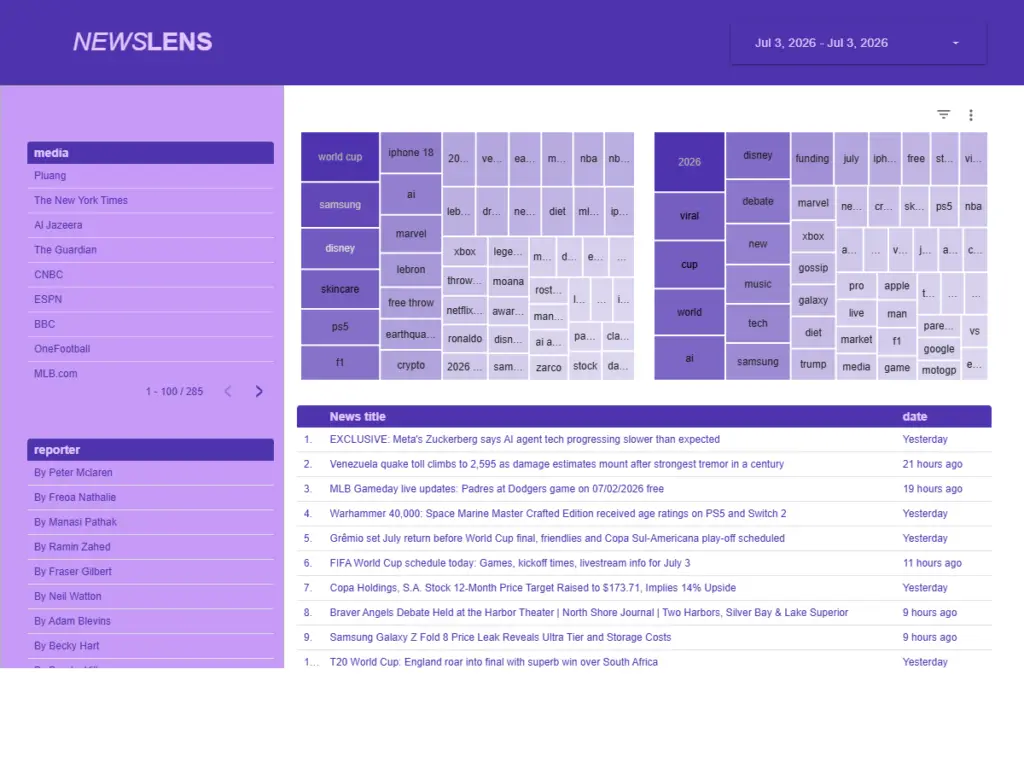
NewsLens is an automated news monitoring and analytics dashboard. It scrapes articles from Google News daily, processes them using natural language processing (NLP), and surfaces insights through an interactive Looker Studio (formerly Google Data Studio) dashboard.
No manual input. No refreshing tabs. Just data — clean, structured, and ready to explore.
Here’s what you can do with it:
- Filter articles by reporter name — track individual journalists and their coverage patterns
- Filter by news outlet — compare how different media cover the same story
- Explore topic clusters visually through an interactive treemap
- Discover trending keywords extracted automatically from article content
- Filter by date range to zoom into specific news cycles
- Read auto-generated summaries of each article alongside freshness indicators — so you know at a glance how old the information is
How It Works
| Layer | Tools |
| News fetching | Google News (PyPi) |
| Web Scraping | Playwright |
| Data Processing | Pandas, Numpy |
| Keyword Extraction | keyBERT |
| Topic Modeling | Scikit-Learn |
| Storage | Google Sheet |
| Visualization | Data Studio (formerly Google Looker Studio) |
Key Features in Detail
Reporter & Media Filters
Most news dashboards show you what is being written. NewsLens also shows you who is writing it and where. Filter by specific reporters or news outlets to analyze coverage patterns over time.
Topic Treemap
Topics are automatically grouped and visualized as a treemap — larger blocks mean more coverage. This makes it immediately obvious which themes are dominating the news cycle at any given moment.
Keyword Treemap
Powered by KeyBERT, keywords are extracted from article text (not just headlines) and visualized in the same way. This gives a more granular view of what specific terms are appearing most frequently across sources.
Article Summary Table
The data table includes auto-generated summaries of each article, the source, reporter, and a freshness indicator showing exactly how old the article is — in hours or days. No need to open every article to know if the information is still relevant.
Date Range Control
Zoom in on any time period to compare how news coverage shifted before and after a specific event.
Why I Built This
Two reasons.
First, practical: I wanted a hands-on project that combined web scraping, NLP, and data visualization in a single end-to-end pipeline — something I could point to and say “I built all of this.”
Second, functional: tools like this have real-world value. PR teams, newsrooms, researchers, and brand managers all need to monitor media. NewsLens is a proof of concept that this kind of system doesn’t have to cost a fortune to build or run.
What I Learned
Building NewsLens end-to-end taught me things that tutorials don’t cover:
- Rate limiting and scraping ethics — how to be a responsible scraper without getting blocked
- NLP in practice — KeyBERT works well for keyword extraction, but needs careful parameter tuning to avoid generic terms
- Data freshness in dashboards — Looker Studio’s data blending and date controls have quirks that require specific workarounds
- Designing for non-technical users — the filters and layout are built so that anyone, not just a data person, can navigate it
What’s Next?
NewsLens is a living project. Planned improvements include:
- Expanding to English-language sources for global coverage
- Sentiment analysis per article and per topic
- Reporter activity tracking over time (trend lines, not just snapshots)
- Automated weekly digest delivered via email or Telegram
See It Live
About The Author
I’m a freelance data analyst and web developer based in Indonesia, focused on building automated data pipelines and analytics tools for remote clients. If you’re looking for someone who can turn messy data into clear, actionable insights — let’s connect.